Your Datasets
- 20 Oct 2023
- 15 Minutes to read
- Print
- PDF
Your Datasets
- Updated on 20 Oct 2023
- 15 Minutes to read
- Print
- PDF
Article summary
Did you find this summary helpful?
Thank you for your feedback
Introduction
Dataset page is the starting point of analysis on the survey. You have to flexibility to take a flat dataset of the survey or a flat score of the survey. You can also select the exact question or indicator. There are dozens of functions provided for advance user, who can make use of them to derive a different output. These are powerful enough to calculate averages, minimum value, maximum value, rank etc. within all filtered survey in the output.
Prerequisite
You need to have a valid survey with at least few responses in it. You can see if your survey is available for dataset here .
Includes Participants that Match
Dataset List

1.Dataset list view : To view all datasets click on this tab.
Search for folders : To search folders checktick this checkbox and search from search textbox.
Search : Search the dataset with the name of the dataset for specific dataset.
Add : Click on add button to add new dataset.
Edit: Click on edit button to edit the dataset manually.
Copy : Click on copy button to create new copy with the same dataset settings but with different name.
Dataset folder view : To view all folders click on this tab.
Dataset Folder

Dataset folder view : To view all folders click on this tab.
Search for folders : To search folders tick this checkbox and search from search textbox.
Search : Search the dataset with the name of the dataset for specific dataset.
Add : Click on add button to add new dataset.
Folder : Click on the folders to view all datasets in that folder.
Dataset list view : To view all datasets click on this tab.
Dataset Folder Files

Dataset folder view : To view all folders click on this tab.
Search in folder : Check this checkbox to search datasets in particular folder.
Search for folders : To search folders tick this checkbox and search from search textbox.
Search : Search the dataset with the name of the dataset for specific dataset.
Add : Click on add button to add new dataset.
Edit : Click on edit button to edit the dataset manually.
Copy : Click on copy button to create new copy with the same dataset settings but with different name.
Dataset list view : To view all datasets click on this tab.
Creating New Custom dataset

Title : Enter the title/name of the new dataset.
Description : This field is used to describe additional information about the dataset.
Includes Participants that Match : Click on the link Includes Participants that Match to select the survey.
Filters: These filters can be used to exclude test companies(i.e. companies with 'test', 'import', or '73bit' in their names) or we can match the participants submitted date with a given date range.
Additional Filters : It is an optional field to filter the participants. Example given below filters the participants using date and display name containing “Test”
((SUBMITTED_DATE() > "2016/01/01") AND (SUBMITTED_DATE() < "2016/04/18")) AND (CONTAINS(DISPLAY_NAME(),"Test") <= 0)
Tags : It is the field where folder names should be written as comma seperated values.
Report id’s of other associated reports : Enter the name of other datasets as comma seperated values. So when main dataset is used in feedback report, all datasets fields can be used whose names are provided in this field.
Allow External Excess : To give dataset access to external users who are not Probench users please refer Allow External Access.
Create : Click on create button to create new dataset. Title is the mandatory field.
Cancel : Click this button to discard creation of dataset.
Add survey responses/scores : Click on this tab to add survey scores or survey responses from survey template.
Fields Details : Click on this tab to edit the fields. Edit field names or field formulas.
After creating dataset only, you can generate dataset. How to generate dataset is shown below in Generating Survey Dataset
Includes Participants that Match
As the name of this field suggest, this field enables users to select the criteria such that only participant/company satisfying this criterias will be included in the report output.

Tick the “Submitted surveys only” checkbox to select the surveys that are submitted by participants.
Tick any of the “Surveys” checkbox or multiple surveys from which you want to generate a dataset.
Once you are done, click on close and proceed further.
Adding Survey Responses/Scores

Add survey responses/scores to the dataset : Click on the tab to add survey responses/scores to the dataset.
List of Survey : Click on the dropdown list box for selecting the survey.
Search Node : It helps you to search text from the nodes.
Select Depth : Click on the dropdown list and select the node level, so survey nodes will expand till that depth. For example a template structure can be starting with sections contains group and within that there is question. So question has 3 level of depth.
Filter Questiontype: Click on the dropdown to filter the question type, which we need in dataset like Radio, Checkbox or text box etc.
Select all nodes : Using this checkbox you can select or deselect all nodes at once.
Select field name generation formula: Select the formula that you want to use to generate the dataset field name.
Add field name formula: Add a formula for generation of dataset field name.
Save field name formula: Save the selected field name for the particular dataset.
Preview field name: Preview the field name that would be generated for the selected field.
Select Nodes : Click on the checkbox to select the nodes one at a time, you can deselect the node.
Add selected responses : Clicking on this button will add the field name and the response formula.
Add selected scores as percent : Clicking on this button will add the field name and the score formula(score will be added as percent).
Add selected scores as points : Clicking on this button will add the field name and the score formula(score will be added as points).
Dataset Details : Click on dataset details to enter details for dataset.
Field Details : Survey Responses/Scored Editing
Advanced Editor : Advanced Editor button to edit the name and formula of the survey response/scores/calculated formula in a text editor format.
Delete field name formula: Deletes the selected dataset formula from the dropdown
NOTE
If you are trying to add a lot of nodes at once, your browser will often freeze temporarily, then you will see the nodes being added one by one. This can take up to 10 minutes for a large module.
Nodes will be automatically named when you add them to your dataset, and those node names become your column headings so you may wish to update them.
You don’t need to press ‘update’ to save your responses in probench editor (though you do in advanced editor). You can just click “generate”.
Dataset field name generation
You can generate the name for the dataset field using a formula rather than using the default name. The formula is split into components that are surrounded by curly braces({}). Each component is split into two parts, 'Selection' and 'Type'. 'Selection' would mean which node are you trying to select and 'Type' would mean what type of data are you trying to retrieve from the selected node. Currently, you can get three types of data for a node:
1.Variable number of the node(using the NO keyword)
2.Title of the node(using the TITLE keyword)
3.Type of the node(using the NAME keyword)
The different types of 'Selection' that we can use are:
1.SELECTED: this would select the node that is currently selected in the node list
2.We can also use the control type of the selected node or the parent of which we want to retrieve the data(ie. if we want to select the parent page, we would use PAGE as the 'Selection' query)
So a typical component of a formula would be {SELECTION_TYPE}.

Consider the above image,
1.If we wanted to get the title of the selected node we would use the formula {SELECTED_TITLE} which would return "Assessment".
2.If we wanted to get the variable number of the group of the selected node, we would use {GROUP_NO} which would return "1" as it is the variable number of the first occurring parent of type group from the selected node.
3.We can also traverse the tree upwards towards the parent by adding the number of levels that we want to traverse. So if we wanted the title of the third parent group from the selected node we would use {GROUP_TITLE3} which would return "Commitment" as it is the third group from the selected node.
You can also combine multiple components to create a formula. Additionally, we can add any characters or words that we want between these components. So considering the above image the below formulas would yield the following field names:
1.{PAGE_NO}_{SELECTED_TITLE}: A1_Assessment
2.{SECTION_NO2}_TEST{GROUP_TITLE3}: Section 1_TESTCommitment
3.SelectedControlTypeIs{SELECTED_NAME}: SelectedControlTypeIs_Radio
Edit dataset

ID : This is a non editable and represents the unique key that is assigned for each dataset.
Title : This field is used as the name of the dataset.
Description : This field is used to describe additional information about the dataset.
Includes Participants that Match : This field can be used to modifiy the criteria for which participants/companies to be included in the report, for more information refer Includes Participants that Match
Filters: These filters can be used to exclude test companies(i.e. companies with 'test', 'import', or '73bit' in their names) or we can match the participants submitted date with a given date range.
Additional Filters : is an optional field to filter the participants. Example given below filters the participants using date and display name containing “Test”
((SUBMITTED_DATE() > "2016/01/01") AND (SUBMITTED_DATE() < "2016/04/18")) AND (CONTAINS(DISPLAY_NAME(),"Test") <= 0)
Tags : We can add the folder name for the dataset.
Generate : Click this button after all the settings are updated to generate the dataset.
After the dataset has been generated the generated file can be downloaded in CSV, XSL, XML format or the output can be viewed in browser using View icon. You can also generate a PowerBI compatible third-party to import the dataset into PowerBI.
Report id’s of other associated reports : Enter the name of other datasets as comma seperated values. So when main dataset is used in feedback report, all datasets fields can be used whose names are provided in this field.
Allow External Excess : To give dataset access to external users who are not Probench users please refer Allow External Access.
Update : Click this button to save the changes after modifying dataset settings.
Delete : Click this button do delete the dataset permanently.
Lock : Click this button to lock the dataset, so that no one can change the settings of dataset until it is being unlocked. It can be locked and unlocked only by the Administrators.
Cancel : Click this button to discard editing of dataset.
Add survey responses/scores : Click on this tab to add survey scores or survey responses from survey template.
Fields Details : Click on this tab to edit the fields. Edit field names or field formulas.
Advanced Editor : Advanced Editor button to edit the name and formula of the survey response/scores/calculated formula in a text editor format.
Survey Responses/Scored Editing

Fields Details : Click on this tab to edit the fields. Edit field names or field formulas.
Add Button : Add the field in survey response/scores/calculated formula.
Edit Button : Edit the name and the formula of the survey response/scores/calculated formula.
Save Button : Save the name and the formula of the survey response/scores/calculated formula.
Cancle Button : Cancel the editing of survey response/scores/calculated formula.
Delete Button : Delete the name and the formula of the survey response/scores/calculated formula.
Add survey responses/scores : Click on this tab to add survey scores or survey responses, from survey template.
Dataset Details : Click on dataset details to enter details for dataset.
Advanced Editor Button : Advanced Editor button to edit the name and formula of the survey response/scores/calculated formula in a text editor format.
Advanced Editor

Include Participants that match : Edit the text field to include the participants with their id.
Additional Filters : It is the same that was there while creating new dataset. It filters the additional data.
Fields : It is the textbox in which all fields are defined and their formulas which we want to include in our dataset. Each field must be prefixed with “***” and separated from the formula by an “=”. This is mostly used by advance user for doing bulk update.
Some useful things you can do using advanced editorUpdate : Click on update after making changes to update the survey responses/scores.
Cancel : Click on cancel to discard the changes.
Some useful things you can do using advanced editor
Reorder your fields: Just copy and paste to move them around. Ensure you take the entire statement and don’t accidentally copy half of the next one as well.
Easily switch reporting years: Copy-paste and entire dataset into word and use search-replace functions to replace node or survey IDs. For example, you can create a report that works on the 2013-14 survey and then replace the survey ID with the 2014-15 survey ID. Assuming your node IDs are the same, that text copied into a report will then magically work for 2014-15.
Generating Survey Dataset

Generate : Click on generate button to generate the dataset.
CSV: Click on CSV icon to download the dataset in CSV format.
XLS : Click on XLS icon to download the dataset in XLS format.
View : Click on View icon to view the dataset in table format.
XML : Click on XML icon to download dataset in XML format.
JSON: Click on JSON to download the dataset in JSON format
PowerBI: Click on PowerBI to generate a PowerBI compatible link to import the dataset into PowerBI. For more information refer How to import dataset into PowerBI
NOTE
- Typically a dataset will take from a few seconds (responses to one indicator) to 10-15 minutes (responses to an entire module, complicated formula) to generate.
- Generating huge datasets can make the reporting tool slower for everyone, so be cautious and if possible try to schedule them for times when many people are not active in the reporting tool.
- You can see when a dataset was last generated - don’t regenerate it unless you really need to (ie the underlying dataset has changed)
Error on generating

Whenever an error occurs while generating, an error will be shown as displayed in the above screen grab.
How to import dataset into PowerBI

Following are the steps to import the dataset into PowerBI:
Click generate reference key to generate the reference key for the third party link. (You only need to generate the reference key once for a dataset)
Click generate secret key to generate a secret key for the third party link. (You only need to generate the secret key once for a dataset)
Click update to update the reference key and secret key.
Click the PowerBi icon to generate a PowerBI compatible third-party link. This link will be copied onto your clipboard.
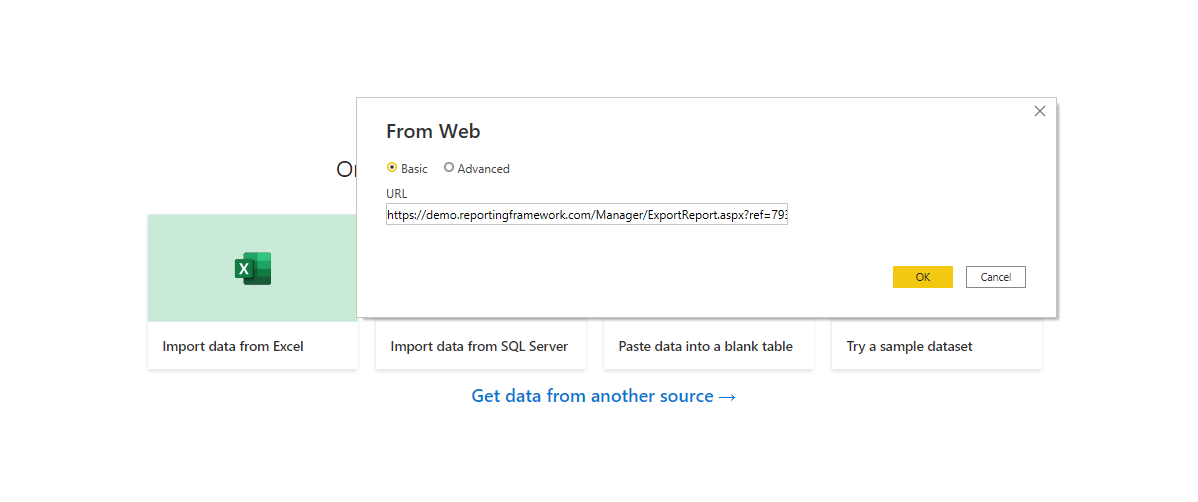
Open PowerBI and select Get data -> Web.
OR
- Click the PowerBi icon to generate a PowerBI compatible third-party link. This will automatically generate reference and secret key and also update the same along with the link to be copied onto your clipboard.
- Open PowerBI and select Get data -> Web.

Copy the link in your clipboard into the address bar and click ok.
It will display a preview of the dataset. Click load to load the dataset into PowerBI.
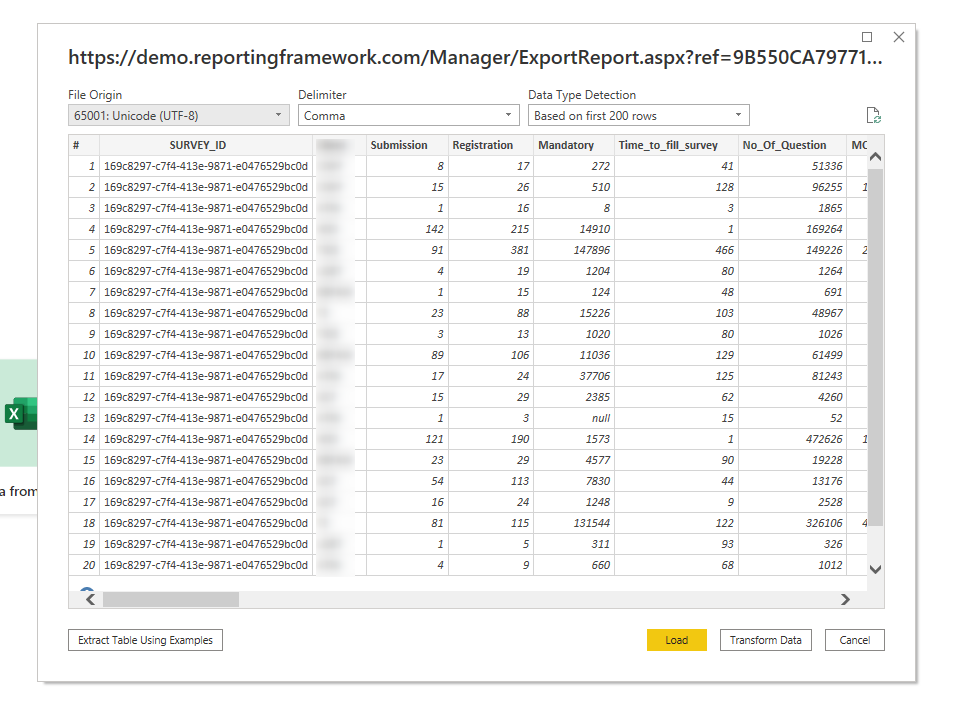
The dataset is now loaded into PowerBI.


Note
The PowerBI third-party generated link will expire after 10 minutes. You will need to generate the link again by clicking on the PowerBI icon after 10 minutes have elapsed.
FAQ's
How to copy an existing dataset?
There are often instances when there is a need to copy one of the existing dataset, and modify based on the modified requirements, following are the steps you should follow to copy an existing report:
On Your Datasets list page click on the Copy icon against the dataset you want to copy.
After step 1 an entry of the copied dataset will be added to the list.
Click on Edit against the new copy of the dataset.
Change the Title of the dataset and modify the values of other fields as required and click on update.
Now click on Advanced Editor go to the bottom of the page and click on Update button at the bottom of the Advanced Editor page.
Only after following step 5 click on the Generate button to generate the dataset. If step 5 is not followed either the generated report will throw an error or the generated would be blank.
When I copy a dataset and generate, returns blank dataset?
Once you copy a dataset and get no data in the dataset i.e. csv or xls file then follow the below mentioned steps.
Edit the dataset
Click on Advanced Editor button on top right of page.
Click Update button on the bottom of the advanced editor page. (Don’t make any changes)
You will be redirected back to Edit page.
Click Generate button on dataset Edit page.
Now try to download the CSV or XLS version of the dataset.
If the above does not solve the issue and the dataset is still blank make sure that you have selected a correct criteria for Includes participants that match field and then generate it again.
Why my reports does not reflect the recent modifications made to the responses and scores
This is a common doubt raised by probench user, following are different questions asked by the users which all lead to common causes:
Responses of a company is displayed on the frontend but it does not end up in my dataset when I download the csv/xls file.
Scores of a company has been modified but the csv/xls dataset does not display the latest scores.
One of the most common causes for the above mentioned doubts is as follows
After making the changes to the responses/scores on the frontend the dataset was not regenerated using the Generate button on the report page. Once the report is regenerated the data for the report is updated with the latest data.
When I copy a dataset and generate, it gives me error?
Once you copy a dataset and get error something similar to the one mentioned below.
The field "your field name will be different" has an error. An unknown error occurred with this field. Please save it again.
Edit the dataset
Click on Advanced Editor button on top right of page.
Click Update button on the bottom of the advanced editor page. (Don’t make any changes)
You will be redirected back to Edit page.
Click Generate button on dataset Edit page.
When we copy the dataset, do not direct generate the dataset, it will give error, first update the dataset and then generate.
Was this article helpful?