List of charts
- 08 Jul 2024
- 1 Minute to read
- Print
- PDF
List of charts
- Updated on 08 Jul 2024
- 1 Minute to read
- Print
- PDF
Article summary
Did you find this summary helpful?
Thank you for your feedback
Below is the list of all the chart types that we have in Probench.
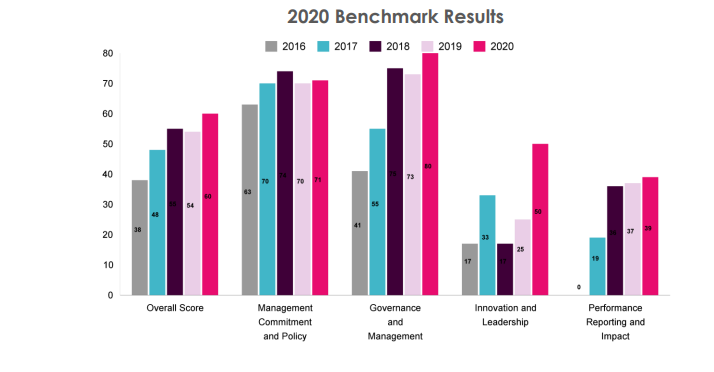
1. Bar Chart: Can be used differently as shown below:
Yearwise comparison of data in verticle form.

Each bar represents different data of comparison

2. Stacked Bar Chart:

3. Horizontal Bar Chart: Can be used differently as shown below:
- Data comparison in horizontal form.


- Data comparison in horizontal form with different dropdown scenario.

4. Doghnut Chart: Can be used differently as shown below:
- Data comparison in Doghnut shape and data will be visible when you hover on each color

5. Radar Chart:

6. Treemap Chart:

Was this article helpful?


